
Review Insights - Sentiment Analysis
Review Insights - Sentiment Analysis
The Review Insights - Sentiment Analysis page helps evaluate the tone of customer feedback, categorizing it as positive, negative, or neutral. By analyzing overall sentiment, businesses can quickly measure customer satisfaction, identify problems, and highlight successes. This analysis provides deep insights into customer perceptions, allowing for more focused improvements and informed decision-making.
The Sentiment Analysis page provides a detailed view of customer sentiment based on the date range you select at the top of the page. The metrics include:
Overall Sentiment - The total breakdown of positive, neutral, and negative feedback.
Category Sentiment - Scores for food, service, experience, and price.
Trend Graph - A visual view of how sentiment shifts over time (daily, weekly, monthly, quarterly, or yearly).
Location Performance - Sentiment by location with expandable details for comparison.
These metrics help you track customer perceptions, measure satisfaction, and identify sentiment trends across all your locations.
Navigating to the Sentiment Analysis Page
To navigate to the The Review Insights - Sentiment Analysis page, click on the Review Insights tab in your dashboard, and then click on the Sentiment Analysis tab.
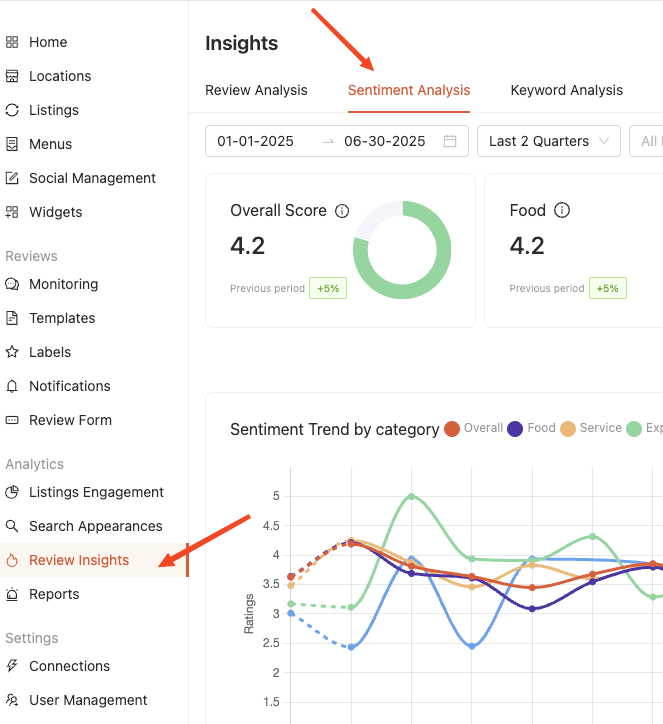
The Sentiment Analysis page is divided into three key sections:
- Sentiment Overview
- Sentiment Trend by Category
- Location Performance Based on Category
At the top of the page, you will see filtering options that allow you to refine your view of the data:
Date Picker - Select a custom date range.
Date Presets - Quickly apply filters like Last 30 Days, Last 2 Weeks, Last 6 Months.
Publishers - Filter data for specific publishers.
Folders/Locations - Filter results by folder(s) or individual location(s).
Labels - Filter results by labels applied to reviews.
Sentiment Overview
The Sentiment Overview section provides a snapshot of customer sentiment, including overall sentiment ratings, category scores for food, service, experience, and price, as well as trend insights that show how customer perception is changing over time.
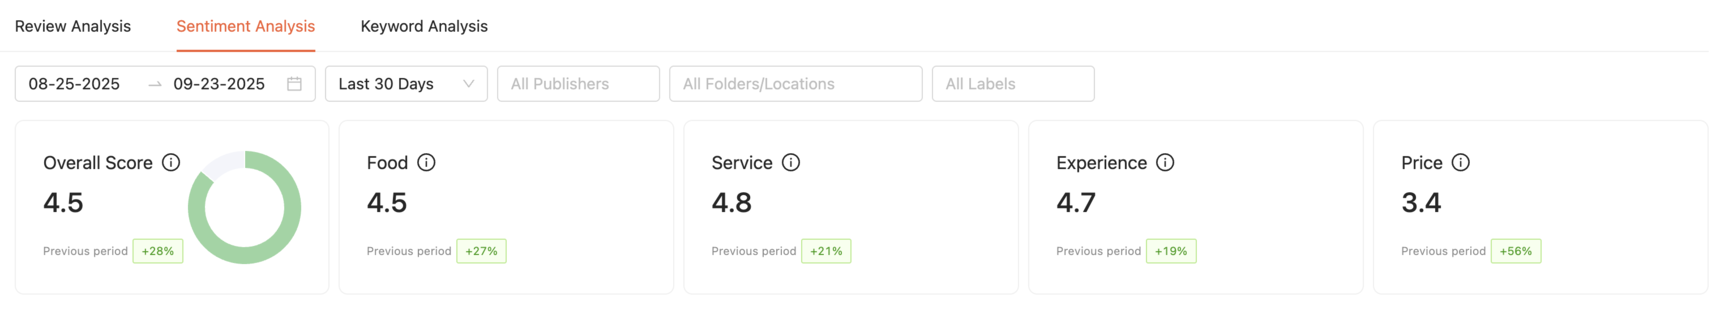
This section displays a breakdown of sentiment ratings:
Overall Score - Shows your overall sentiment score for the selected period, along with the percentage change compared to the previous period.
Food Score - Sentiment score for food-related reviews.
Service Score - Sentiment score for service-related reviews.
Experience Score - Sentiment score for customer experience feedback.
Price Score - Sentiment score for pricing-related reviews.
Sentiment Trend by Category
The Sentiment Trend by Category graph shows how customer sentiment changes over time for overall scores and specific categories like food, service, experience, and price. You can toggle between daily, weekly, monthly, quarterly, or yearly views to see both short-term fluctuations and long-term patterns. This view helps you compare categories side by side and quickly identify trends that highlight strengths and areas for improvement across your locations.
Insights from the Graph:
Comparative Trends - See how sentiment categories perform relative to each other to uncover strengths and weaknesses.
Time-Based Insights - Identify short-term fluctuations and long-term shifts using daily, weekly, monthly, quarterly, or yearly views.
Actionable Patterns - Use these insights to monitor changes, respond quickly to emerging issues, and measure the impact of improvements.
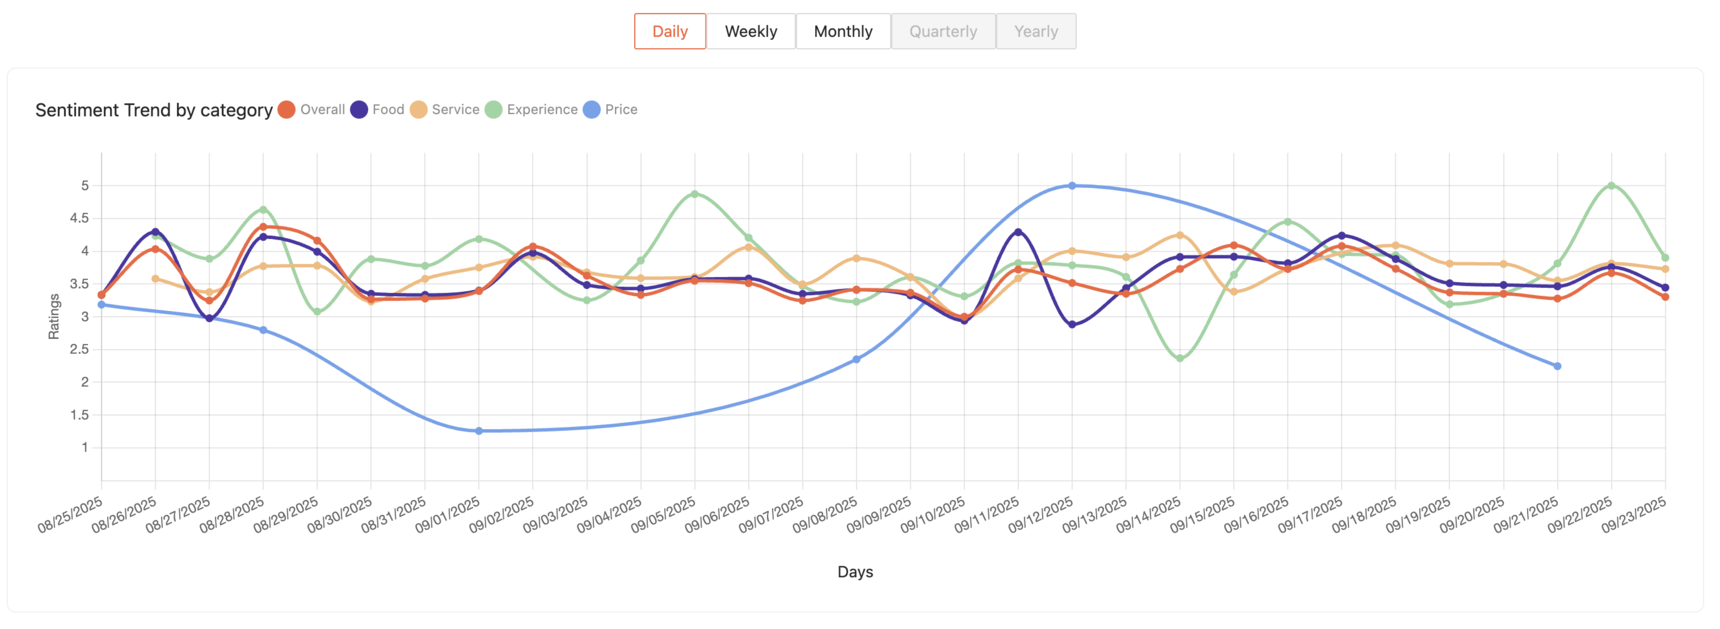
You can switch the graph between daily, weekly, monthly, quarterly, or yearly views to see how sentiment changes over time. Hovering over any point reveals a tooltip with the exact overall sentiment score, as well as on-premises and off-premises scores for that period, giving you a clear, detailed view of customer perception.
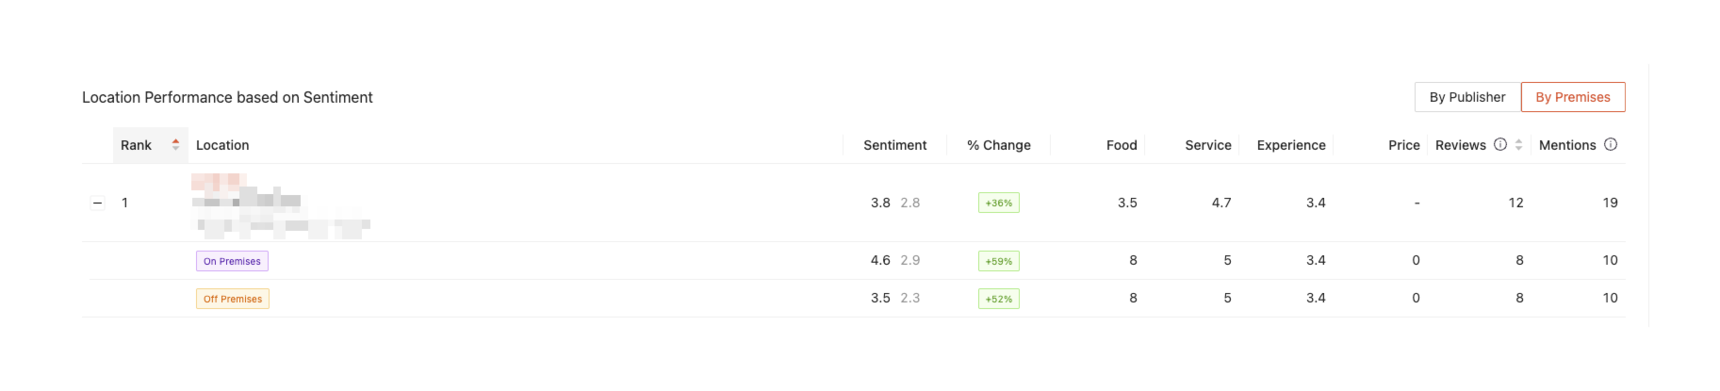
Location Performance Based on Category
The Location Performance by Category section provides a detailed breakdown of sentiment performance across all locations. Each location is ranked and scored based on overall sentiment, with additional category scores for food, service, experience, and price. This makes it easy to compare performance across multiple locations and identify where specific strengths or challenges exist.
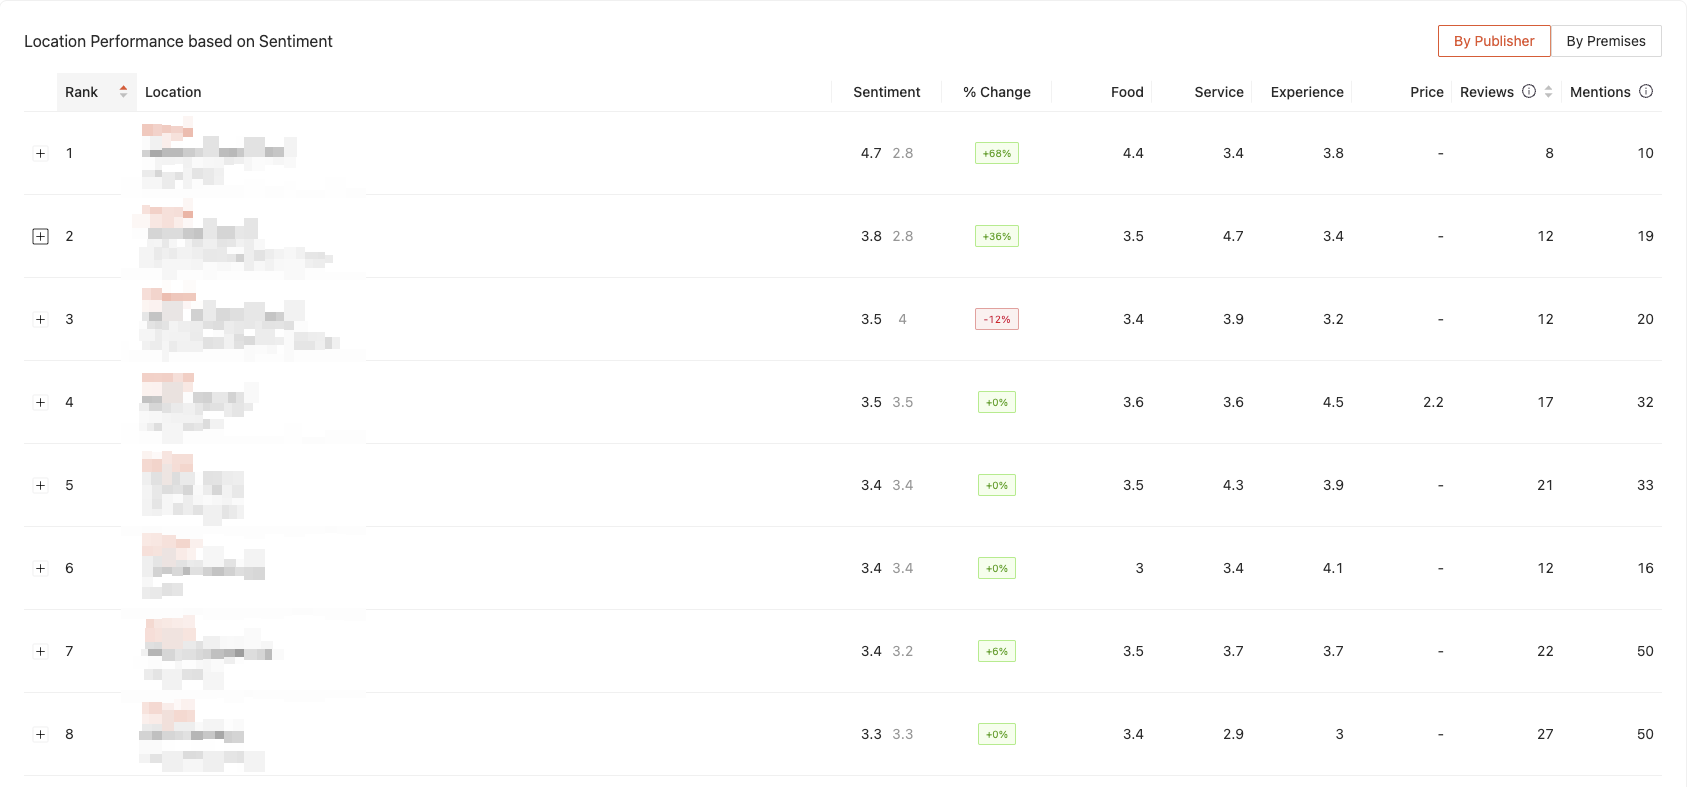
Toggle Options:
On-Premises vs. Off-Premises - Compare sentiment across in-location experiences and off-premises services.
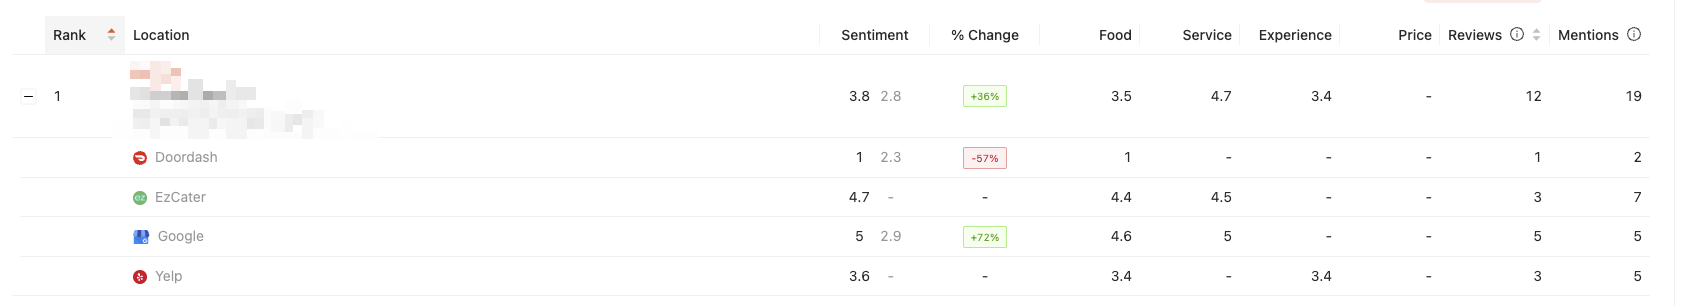
Publishers - View sentiment performance by publisher.
Metrics:
Overall Sentiment Score - Average sentiment rating for on-premises vs. off-premises experiences.
% Change - Difference in sentiment compared to the previous period.
Food - Sentiment score for food-related reviews by premise type.
Service - Sentiment score for service-related reviews by premise type.
Experience - Sentiment score for overall guest experience by premise type.
Price - Sentiment score for pricing and value reviews by premise type.
Reviews - Number of reviews tied to on-premises vs. off-premises visits.
Mentions - Number of times keywords related to food, service, experience, or price were mentioned in reviews by premise type.
Each location also includes an expandable view, allowing you to see more detailed category performance and metrics at the individual location level.
Premise View
Publisher View
Conclusion to Review Insights - Sentiment Analysis
The Sentiment Analysis section brings together overall scores, category trends, and location-level performance in one place, giving you a clear and actionable view of customer perception. By filtering data by date range, publisher, location, or label, you can focus on the insights that matter most. Whether you’re tracking sentiment shifts over time, comparing on-premises vs. off-premises experiences, or identifying strengths and opportunities at the location level, these insights empower you to respond effectively and make data-driven decisions that strengthen the guest experience.
If you need any further assistance, feel free to contact support at support@marqii.com or
text 1 888-597-2939.