Review Insights - Review Analysis
Last updated: July 14, 2026
Review Analysis
The Review Insights – Review Analysis page provides a detailed view of your ratings, response rate, response time, and review frequency. Review data is available at both the location level and the publisher level, allowing you to compare performance, identify rating trends, and uncover opportunities for improvement. This analysis gives you a clear picture of customer perception and helps guide actions to strengthen overall satisfaction.
The Review Analysis page provides a detailed view of your review performance based on the date range you select at the top of the page. The metrics include:
Total Reviews - The total amount of reviews collected within the selected date range.
Response Rate – The percentage of your reviews you’ve responded to.
Response Time – The average time it takes you to respond to reviews.
Review Frequency – The average number of reviews received per day.
These metrics help you track review activity, measure responsiveness, and identify rating trends across all your locations.
Navigating to the Review Analysis Page
To navigate to the Review Insights – Review Analysis page, click on the Review Insights tab in your dashboard.
By default, the Review Insights tab opens to the Review Analysis page.
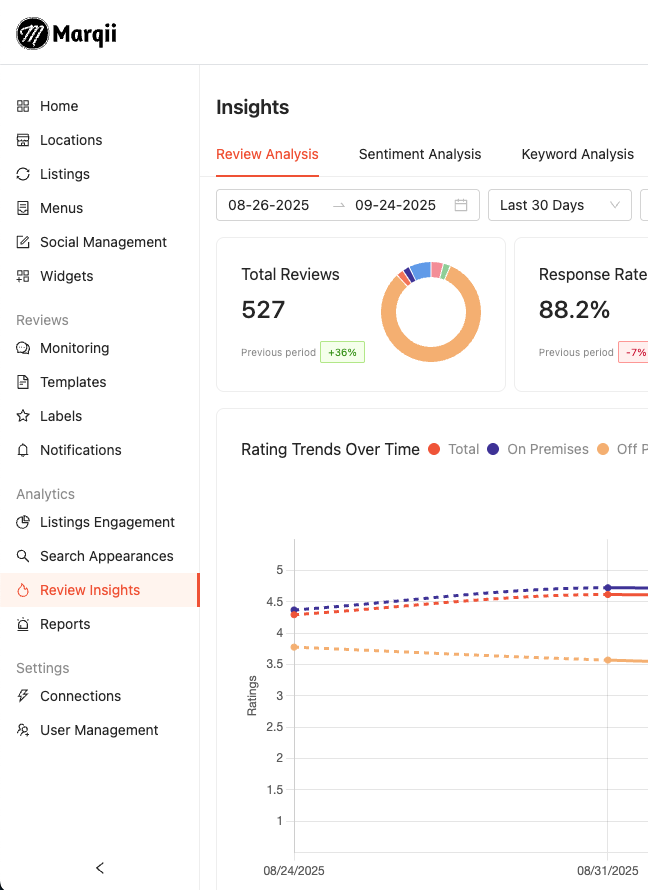
The Review Analysis page is divided into three key sections:
Rating Overview
Rating Trends Over Time
Location Performance Table
Filters:
At the top of this section, you can refine the data using:
Date Picker - Select a custom date range.
Date Preset - Quickly apply presets such as Last 30 Days, Last 2 Weeks, Last 6 Months, etc.
Folders/Locations - Filter results by location(s) or folder(s).
Publishers - Filter data for specific publishers.
Labels - Filter results by labels applied to reviews.
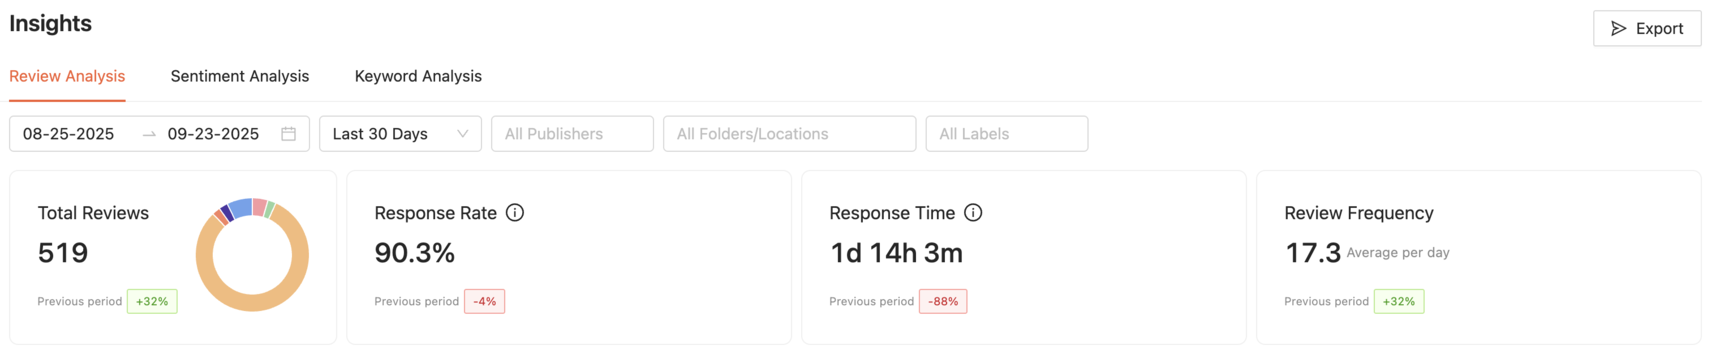
Rating Overview
The Rating Overview section provides a snapshot of your review performance, including your total number of reviews by publisher, as well as key engagement metrics like response rate, response time, and review frequency.
Metrics:
Total Reviews - The total number of reviews collected across all publishers
Response Rate - The percentage of reviews you’ve responded to.
Response Time - The average time it takes you to respond to reviews.
Review Frequency - The average number of reviews received per day.
Rating Overview Drawer
Clicking anywhere in the Rating Overview section opens a drawer with a detailed view of your ratings, based on the filters you've applied on the Ratings Overview section.
Note: To filter by folder or location in the overview drawer, you must first set the Folder/Locations filter in the main Rating Overview section.
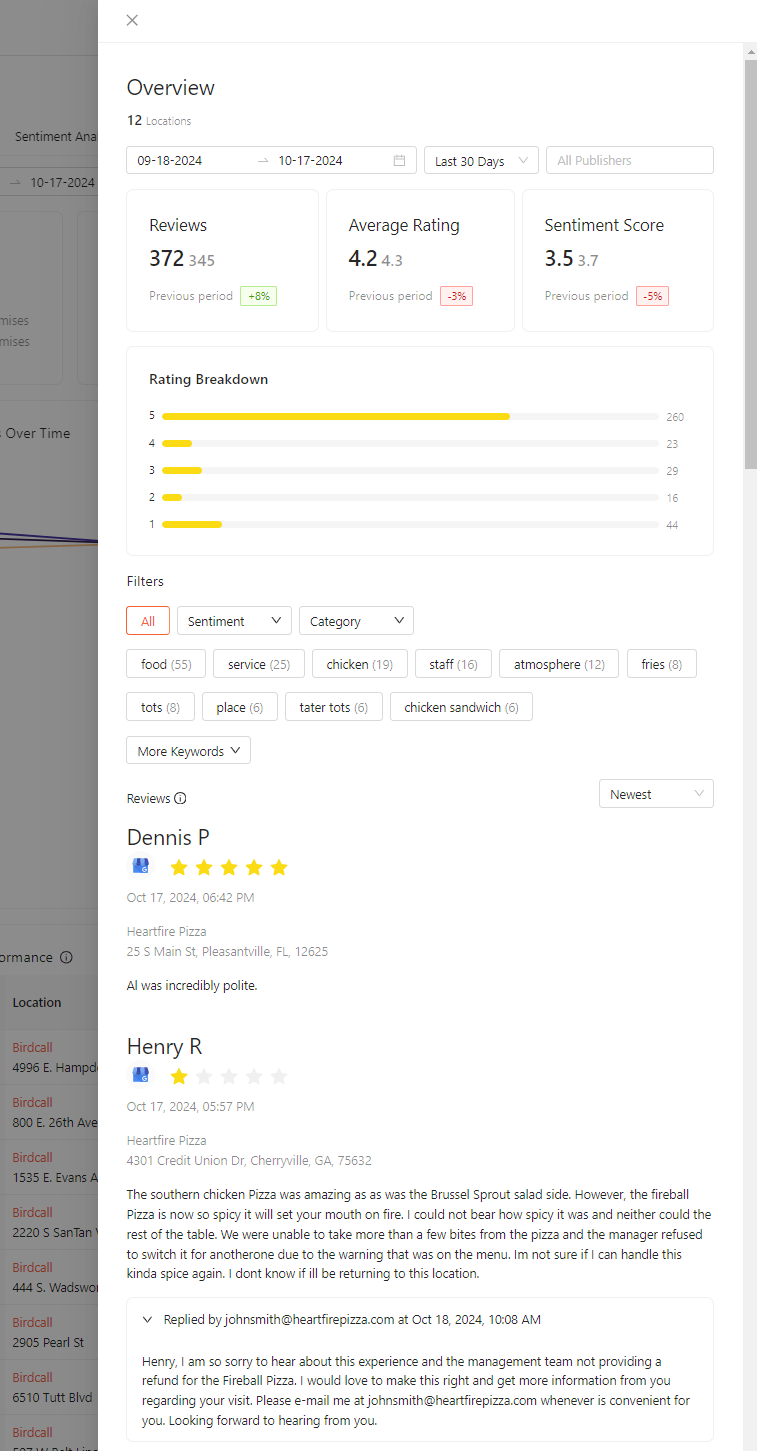
At the top of this drawer, you’ll find:
Filters - Date Picker, Date Preset Picker, and Publisher.
Review Count - The total number of reviews received in the selected period, compared with the previous period, along with the percentage change.
Average Rating - The average rating for the current and previous periods, plus the percentage difference.
Sentiment Score - Sentiment analysis for the current and previous periods, with percentage difference.
Rating Breakdown - The distribution of all reviews across the five-star scale.
At the bottom, you’ll see the reviews and replies for the selected period. This section can be further filtered by:
Sentiment - Positive, Negative, Neutral.
Category - Food, Service, Experience, Price.
Keywords - Common words mentioned in reviews.
Rating Trends Over Time
The Rating Trends Over Time graph visually tracks how your review ratings change over a selected period, across publishers as well as on-premises and off-premises feedback. By highlighting patterns and shifts in customer satisfaction, this tool helps you spot emerging issues, measure the impact of operational changes, and take proactive steps to improve your ratings.
Premise Based Ratings Trends Over Time Graph:
The default view for this graph will show On-Premises vs. Off-Premise. The filters at the top of the page will impact the data in these graphs
Metrics:
On-Premises Reviews - Reviews from dine-in focused publishers (e.g., Yelp, Google, OpenTable, Facebook, TripAdvisor). In the line graph, each data point represents the average rating for on-premises reviews during the selected time period. Hovering over a point displays a tooltip with the exact rating value.
Off-Premises Reviews - Reviews from delivery or takeout focused publishers (e.g., ezCater, Grubhub, DoorDash, Uber Eats). Off-premises reviews are displayed the same way, with tooltips showing the precise ratings for each time period.
Total Ratings - The combined view of both on-premises and off-premises reviews, giving you an overall picture of performance.
Rating Breakdown - A distribution of reviews by star rating (1–5), helping you understand the balance of positive vs. negative feedback.
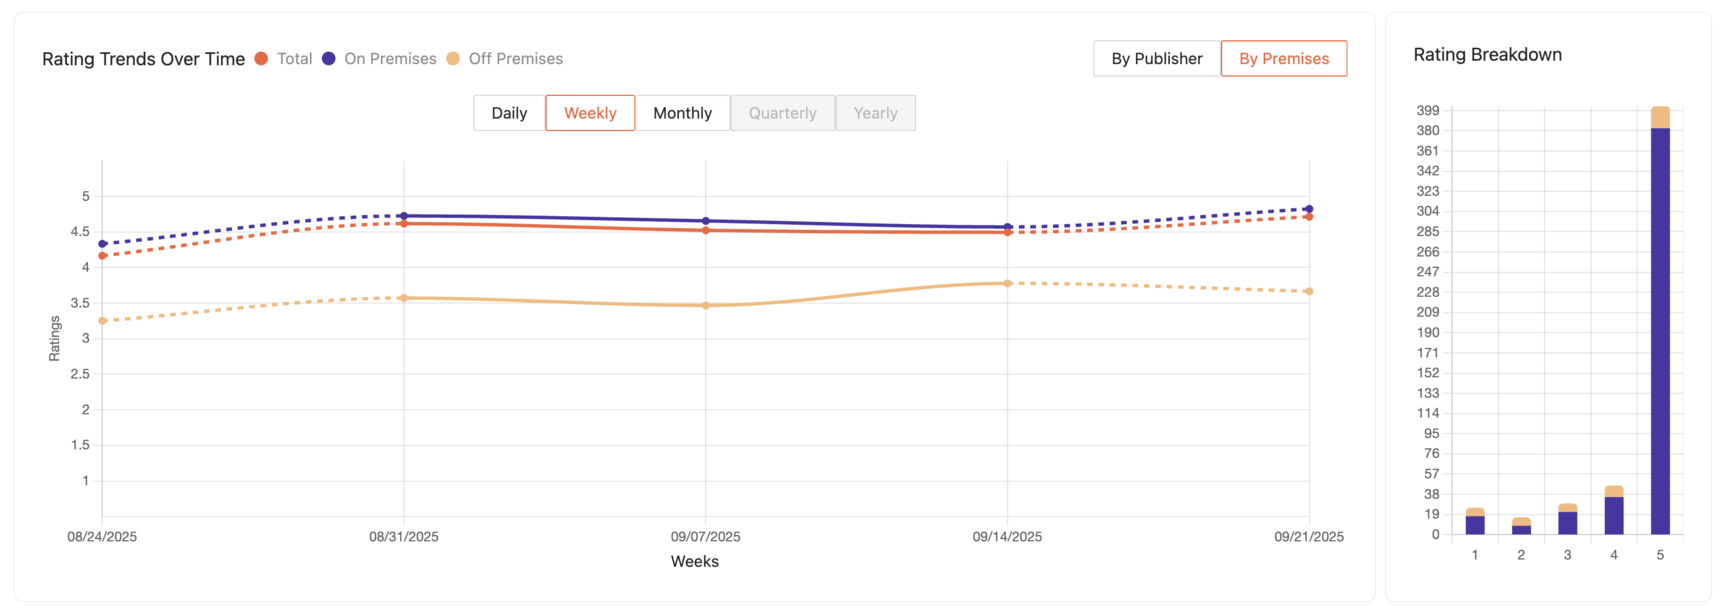
Publisher Based Ratings Trends Over Time Graph:
You can change the view of this graph to show data by publisher instead of premise by selecting the "By Publisher" option
Metrics:
Publisher Reviews - Reviews from individual publishers (e.g., Google, Yelp, Facebook, TripAdvisor, Grubhub, etc.). In the line graph, each data point represents the average rating for a publisher during the selected time period. Hovering over a point displays a tooltip with the exact rating value.
Total Ratings - The combined view of all publisher reviews, giving you an overall picture of performance.
Rating Breakdown - A distribution of reviews by star rating (1–5), segmented by publisher, helping you see how feedback trends differ across platforms.
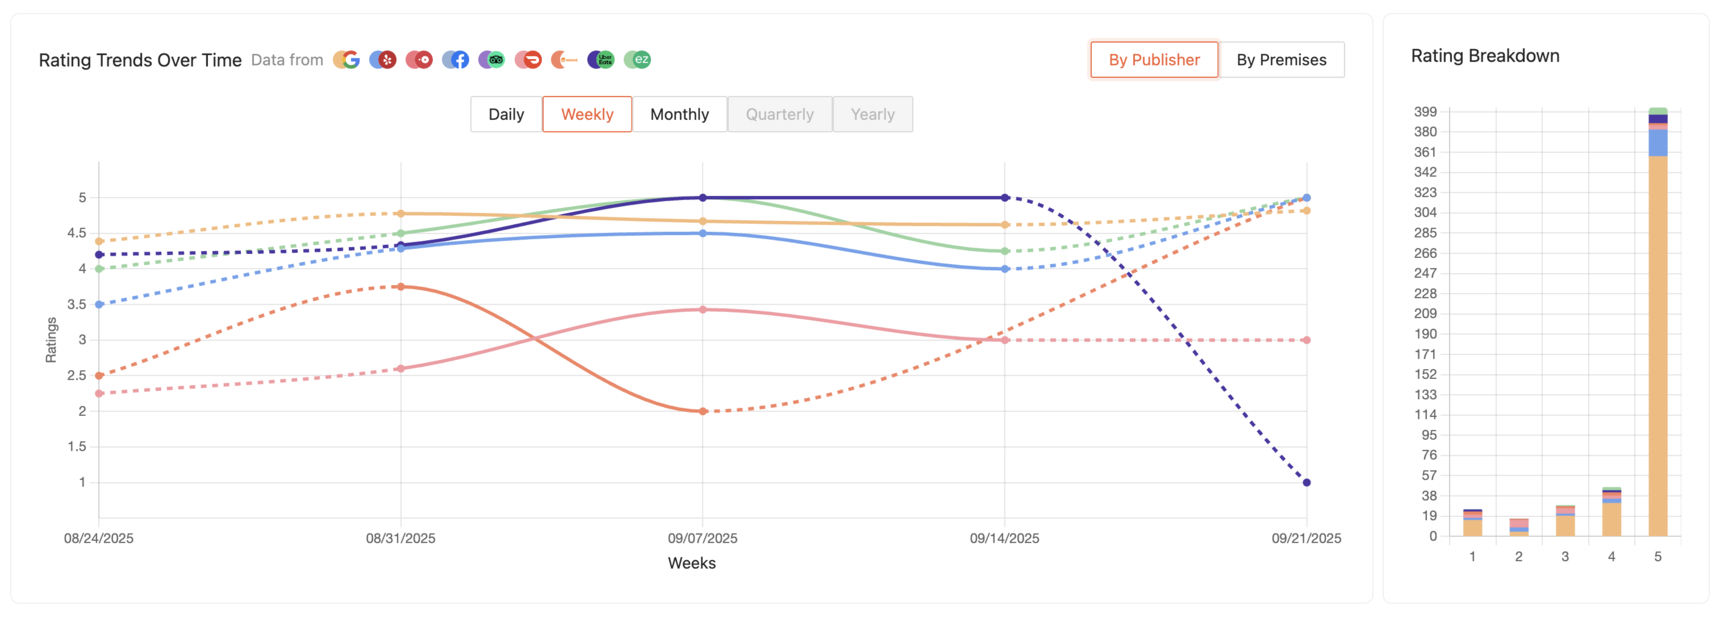
You can switch these graph between daily, weekly, monthly, quarterly, or yearly views. Hovering over any point shows a tooltip with the exact ratings for each publisher during that period, along with the overall total.
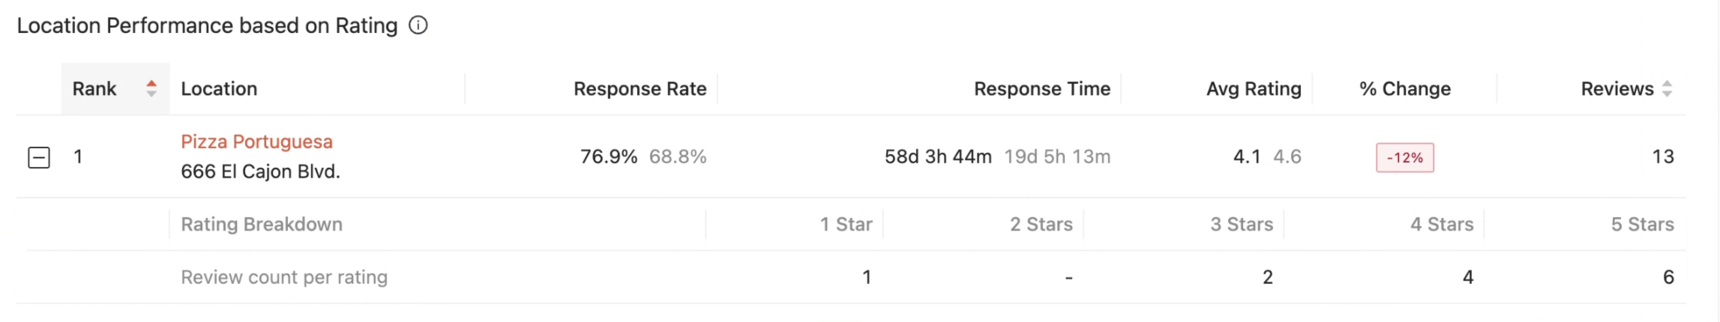
Location Performance Table
The Location Performance Table provides a detailed view of each location’s review performance and response activity. For every location, the table displays:
Rank - The performance ranking of each location compared to others.
Location - The name and address of the location.
Response Rate - The percentage of reviews that received a reply.
Response Time - The average time it takes to respond to reviews.
Average Rating - The current average review rating for the selected period.
Previous Rating - The average rating from the prior period, displayed for comparison.
% Change - The difference between the current and previous ratings, shown as a percentage.
Reviews - The total number of reviews received in the current period.
Each row can be expanded to display additional rating details:
Rating Breakdown - A distribution across 1-star through 5-star ratings.
Review Count per Rating - The exact number of reviews that contributed to each star rating.
This table helps you compare performance across locations, track improvements or declines over time, and identify both top-performing and underperforming locations. With the addition of response rate, response time, and granular rating details, you can now evaluate not only customer sentiment, but also how effectively your team is engaging with feedback. These insights make it easier to prioritize improvements and drive customer satisfaction across all locations.
Location Summary Drawer
Clicking on a location in the Location Performance Table opens the Location Summary Drawer. This drawer gives you a clear snapshot of how a specific location is performing over a selected time period, making it easy to monitor customer feedback, sentiment, and review activity at a glance.
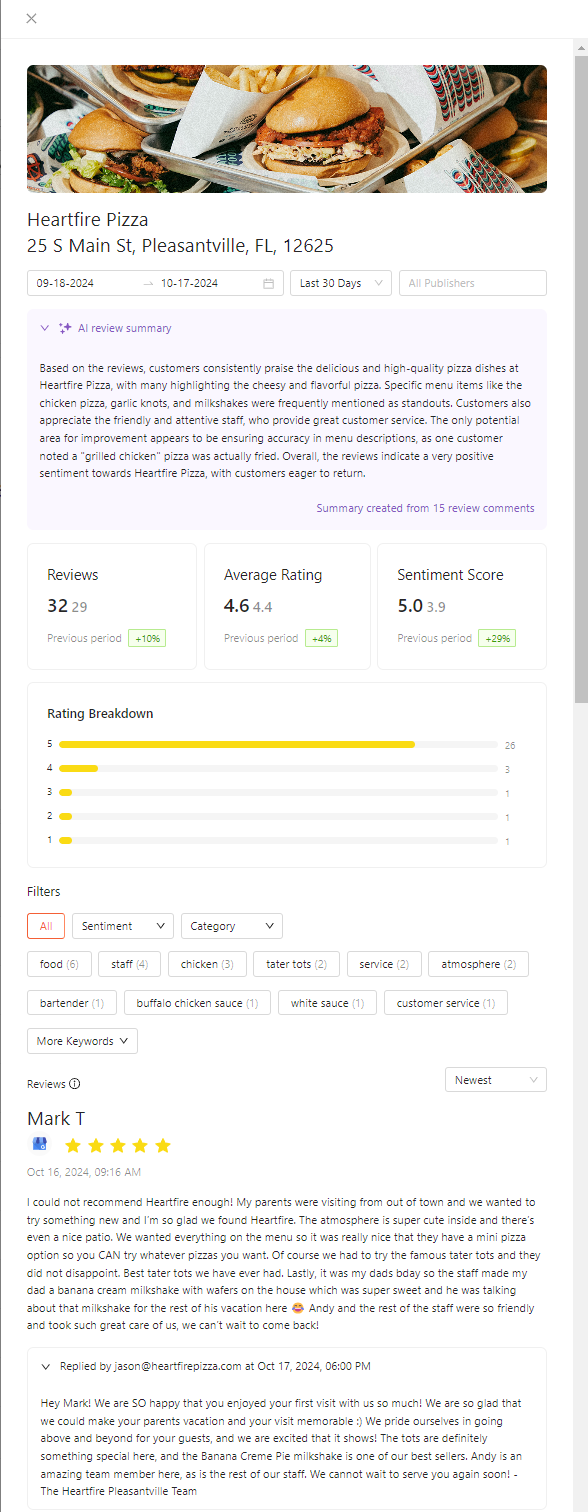
At the top of the drawer, you’ll find:
Filters - Adjust the data shown using the Date Picker, Date Presets (e.g., Last 7 Days, Last 30 Days), and Publisher filter.
AI Review Summary - An AI-generated overview of customer feedback trends for the selected period.
Reviews - The number of reviews received during the current period, compared to the previous period, with the percentage change.
Average Rating - The average star rating for the current period alongside the previous period, plus the percentage difference.
Sentiment Score - An overall sentiment score based on review content, with comparisons to the previous period.
Additional sections include:
Rating Breakdown - A visual distribution of reviews across the five-star scale, showing how many 1-star through 5-star reviews the location received.
Reviews Feed - A list of individual reviews and their responses. Reviews can be filtered by:
Sentiment - Positive, Negative, Neutral
Category - Food, Service, Experience, Price
Keywords - Specific terms mentioned in reviews (with keyword counts displayed)
This drawer gives you both high-level insights and detailed review context, helping you track performance, spot trends, and act quickly on customer feedback.
Conclusion to Review Insights - Review Analysis
The Review Analysis section brings together ratings, response performance, and review trends in one place, giving you a clear and actionable view of customer feedback. By filtering data by date range, publisher, location, or label, you can focus on the insights that matter most. Whether you’re tracking overall satisfaction, comparing performance across locations, or identifying areas for improvement, these insights empower you to respond effectively and make data-driven decisions that strengthen the guest experience.
If you need any further assistance, feel free to contact support at support@marqii.com or text (512) 967-3739.