
The Listings Engagement Page - Views, Clicks, and Engagements
The Customer Interactions section of the Listings Engagements page focuses on Views and Clicks related to your locations over time.

At the top of the page we can see an overview of
- Listings Engagements - the total amounts of views and clicks
- Views - how Number of times your business profiles were seen
- Clicks - Number of times customers interacted with your business profile through action buttons (directions, calls, website, etc)
In this section we can see the can see:
- The data for the current period in bold

- The data for the previous period in grey
- The percentage difference between both periods, +Green for
an increased percentage and -Red for a decreased percentage.
Below the overview, we can see a visual representation on the trends for the views an clicks for your location over time.
These graphs can be switched to Daily, Weekly, Monthly, Quarterly, and Yearly Views.

Hovering over the lines in these graphs will show a tooltip with a breakdown of the relevant data for that day.

Note: Each of the lines in these graphs are color coordinated with the interaction breakdowns for the relevant date.
Below the Views and Clicks graphs we are able to view the data breakdown for Views and Clicks within the individual publishers.
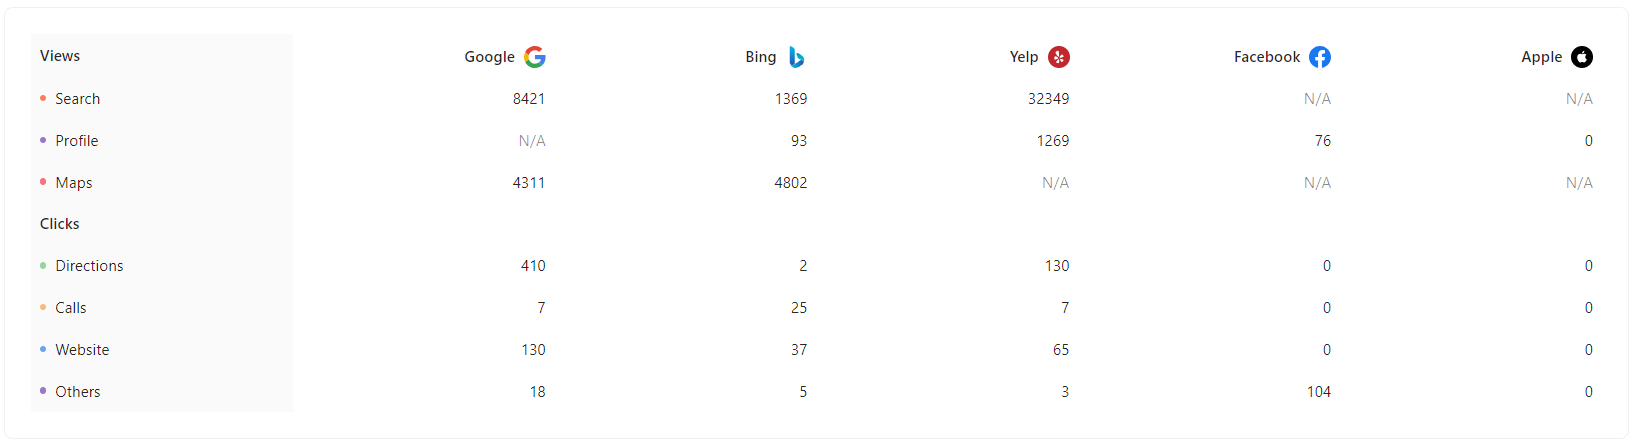
Hovering over each of these rows will alter the graphs to show those specific datapoints. You can click on multiple rows to toggle on/off specific datapoints in the line graphs.

If you need any further assistance, feel free to contact support at support@marqii.com or
1 888-597-2939.